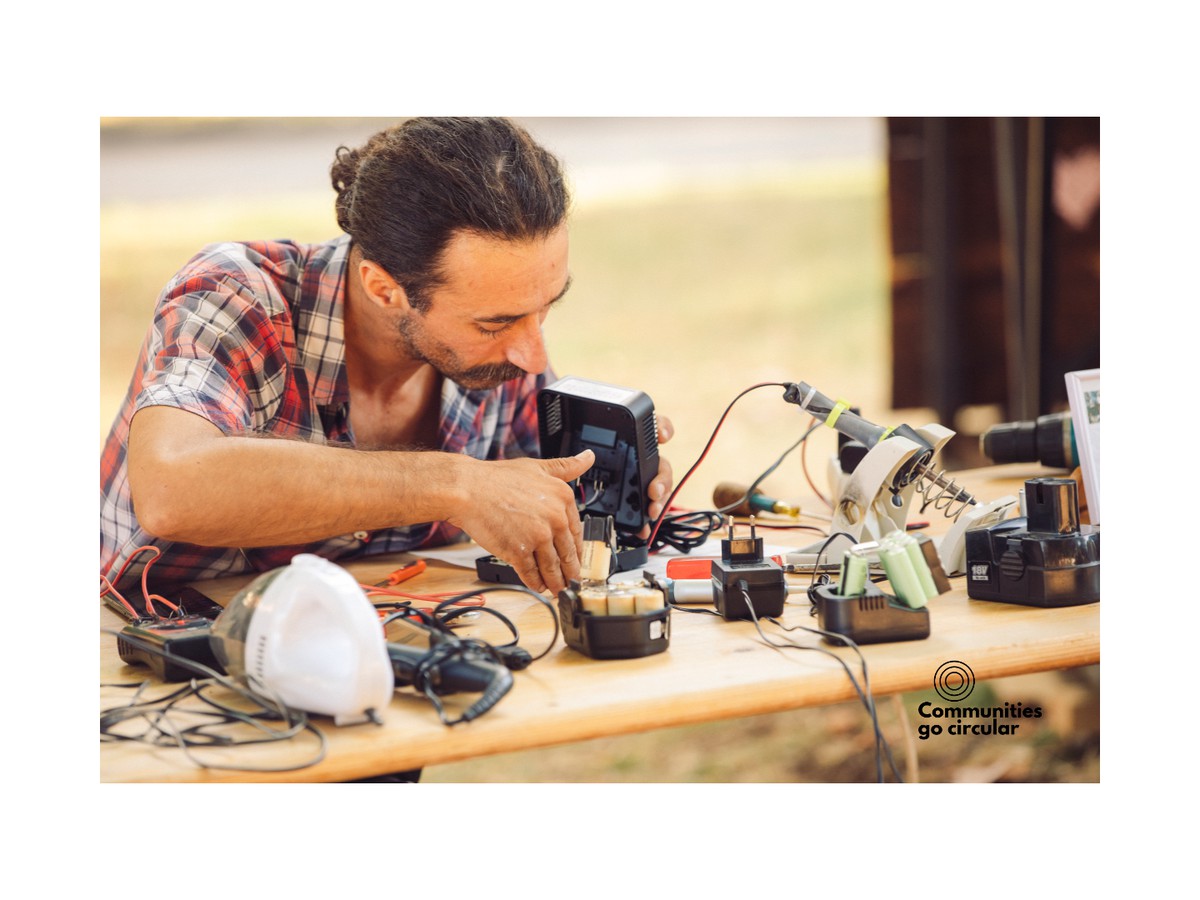
One of the activities of the Communities go Circular project was to examine our attitudes toward repairs, particularly what factors motivate or discourage us from repairing things. A survey on repairs was conducted in 2024.
The survey was open from mid-May to mid-July and was accessible online. All project partners distributed it through their own channels and also asked partner organizations for help. A total of 779 participants fully completed the survey: 209 (26.82%) in Slovenian, 148 in Croatian (18.99%), 396 in Italian (50.83%), and 26 in English (3.33%). Nearly two-thirds of the respondents were women (65.85%). The largest group reached by the survey were those aged 55 and older (39.67%), followed by those aged 45-54 (26.83%) and 35-44 (21.18%). Most respondents had a university-level education, with 30.55% holding a level VII degree, followed by 18.74% with level VIII and 16.17% with level VI. A total of 15.02% of respondents reported that their average gross monthly household income was between 1501-2000 euros, 12.58% earned between 1000 and 1500 euros, and 12.45% earned between 2000 and 2500 euros.
In the past year, 556 respondents (71.37%) had taken an item for repair, with clothing repairs (58.99%), vehicles (56.47%), and footwear (48.56%) being the most common. The least popular items to repair were hobby tools (6.47%), home accessories (7.55%), and sports equipment (9.71%). When asked where they take items for repair, most respondents chose “handyman” or “artisan,” with just over half (51.44%) also selecting official repair and service centers. On average, respondents spent 448.20 euros on repairs in the past year, with notable differences between nationalities: Italians spent the most, an average of 485.80 euros, while Slovenians and Croatians spent almost the same amount: 378.53 euros and 377.89 euros, respectively.
Even more respondents preferred to repair items themselves rather than take them in for repair: in the past year, 80.23% of respondents had repaired something on their own (86.65% of Slovenians, 81.76% of Croatians, and 76.77% of Italians). Among those who did repairs themselves, clothing repairs were the most common, with over three-quarters (75.90%) reporting they had mended clothes. Furniture (52.70%) and home accessories (44.06%) were also popular for self-repair, while large household appliances (10.61%) and sports equipment (12.05%) were the least frequently repaired. Most respondents (88.16%) have the tools needed for repairs at home.
The survey also asked about acceptable prices and the age of items for repair. For pricing, more than half of the respondents (57.89%) said the acceptable price depends on the item, with other responses being evenly split among various lower price thresholds or that price is not important. A similar pattern emerged with the question: "How old could an item for you to consider repairing it if it breaks?" Nearly half (48.91%) said it depends on the item, while just over a third (36.46%) said that age is not an important factor.
The central part of the survey focused on testing attitudes toward various factors influencing repairs. Respondents rated their agreement with statements on a Likert scale from 1 (strongly disagree) to 5 (strongly agree). The statements were translated and adapted to the local context from a survey by Nazlı Terzioğlu (2021).
The statements with the highest agreement levels were: "I take an item for repair when it breaks because … I am concerned about the growing amount of waste, and by doing so, I am helping the environment." (4.3), "I need the item, regularly use it, and would like to continue using it." (4.1), "The item is of good quality." (4.0), and "I know where to take the item for repair." (4.0). Other highly ranked statements included: "I repair an item myself when it breaks because … the item is easy to repair." (3.9), "The materials and spare parts for repair are available." (3.9), "I take an item for repair because … the repaired part is durable, and the item will not break again quickly." (3.9), "It is right to repair things; I would feel bad if I didn’t." (3.9), and "By repairing, I send a message to those around me and encourage them to repair things too." (3.9). Most of the highly ranked statements describe technical factors that influence repair decisions. The lowest-ranked statements were: "I take an item for repair when it breaks because … the repaired item doesn’t look like it’s been repaired, as I want to avoid stigma." (2.6), "With repairs, I can make the item stronger." (3.1), "I can make the item more interesting without ruining its aesthetic value." (3.2), and "Repairing the item does not take much time." (3.2).
Responses to the question about the Right to Repair were nearly evenly split: 52.50% had heard of the term, with the highest recognition among Italians (56.06%). Respondents most often defined the right to repair as the ability to repair (28.72%), the manufacturer’s obligation (23.14%), and the consumer’s right (22.87%). Environmental considerations were mentioned by 14.63% of respondents, and legislation by 7.71%.
A large majority of respondents believe that their country should introduce a reduced VAT rate for repairs (98.46%), and somewhat fewer (90.50%) said that such a measure would encourage them to repair more frequently. Additionally, 92.55% of respondents said they would be motivated to repair items more often if repair vouchers were introduced. Respondents also highly value the repairability rating of products, with 93.58% indicating that they would consider such a rating when purchasing a product. However, interpretations of this rating vary: when asked what they would infer from a product with a repairability score of 3.5 out of 10, over half (52.14%) believed that the product is poorly or difficult to repair, while 42.77% thought it was not worth repairing. More than 17% said they didn’t know how to assess repairability, and 4.17% said they would need more information. Only 3.33% of respondents viewed a score of 3.5 as good or reasonable for repair. Just under one-third (32.86%) of respondents are familiar with platforms promoting reuse.
We were also interested in whether repair frequency varies among groups: women took items for repair slightly more often than men (72.71% vs. 68.09%), but the difference was more pronounced with age: 75.40% of those aged 55 and older had taken an item for repair in the past year, compared to 56.82% of those aged 25-34. The frequency of repairs increases with education level (except for levels I and II, where there were fewer than 10 respondents): in the past year, 58.06% of those with a level III education took an item for repair, compared to 80.82% of those with a level VIII degree. Household income also partially influenced repair habits: 68.25% of those earning less than 1000 euros gross per household had taken an item for repair in the past year, compared to 69.39% of those earning between 1000 and 1500 euros. For higher income brackets, the percentage was over 70% (with the highest, 85.71%, among those earning between 4500 and 5000 euros).
We also examined differences in DIY repairs. Here, men were slightly more active (81.71% vs. 79.53%), and people in their mid-years were the most likely to engage in DIY repairs (84.24% of those aged 35-44 and 83.25% of those aged 45-54). Among younger people (aged 25-34) and those over 55, the percentage was around 76%. DIY repair rates increased with education level from level III (74.19%) to level VI (84.13%), but then began to decrease again, with 78.08% of respondents with level VIII education having repaired items themselves in the past year. No meaningful connection or differences were found between household income levels regarding DIY repairs.
#CERV #communitiesgocircular #reuse #repair #zerowaste #re-geppetto
The survey was conducted part of the “Communities Go Circular” project. The project is funded by the European Union under the "Citizens, Equality, Rights and Values Programme (CERV)". Views and opinions expressed are however those of the authors only and do not necessarily reflect those of the European Union or the European Education and Culture Executive Agency (EACEA). Neither the European Union nor the EACEA can be held responsible for them.


